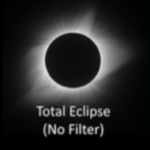
Contents

7. Health Risk Factors and Prevention. 7-1

Smoking. 7-2

Health Screening Tests. 7-8

Serum Cholesterol Levels. 7-8

Elevated Cholesterol Levels. 7-9

High Blood Pressure. 7-10

Cancer Screening. 7-13

Lifestyle Factors. 7-13

Physical Activity. 7-13

Overweight and Obesity Status. 7-14

Tables and Figures

Table 7‑1: Health Risk Factors and Prevention Summary Table. 7-1

Figure 7‑1: Current Smoking Among Adults, U.S., Indiana, and Marion County, 2000-2006. 7-4

Table 7‑2: Prevalence of Smoking in Marion County by Age, Race, and Gender Groups, 2005  7-5

Figure 7‑2: Smoking Prevalence in Marion County Adults Over 18, by Race and Gender, 2001 and 2005  7-5

Figure 7‑3: Marion County Smoking by Education Level7-6

Table 7‑3: Marion County Prevalence of Smoking in Adults, by Race, Gender and Educational Achievement, 2005  7-7

Figure 7‑4: Marion County: Smoking Status, 2002 and 2005. 7-8

Figure 7‑5: Adults with Cholesterol Screening, Past 5 Years: Marion County, Indiana, and U.S., 2001-2005  7-9

Table 7‑4: Percentage of Screened Marion County Adults Told They Have Elevated Cholesterol, by Race and Gender, 2005. 7-10

Figure 7‑6: Percentage of Screened Adults Told Their Cholesterol Was High, Marion County, Indiana, and U.S., 1999-2005. 7-10

Table 7‑5: Percentage of Marion County, Indiana and U.S. Adults Told by a Health Professional That They Had High Blood Pressure, by Race and Gender, 2005. 7-12

Figure 7‑7: Marion County Adults Reporting Multiple Cardiovascular and Respiratory Conditions, 2005  7-12

Figure 7‑8: Frequency of Walking for Exercise, by Gender and Race, Marion County Adults, 2005  7-14

Figure 7‑9: Percent of Non-Pregnant Marion County Residents, Age 18 Years or Older, by BMI Category, 2005  7-16

Table 7‑6: Prevalence of BMI Categories, Marion County Adults, 2005. 7-16

Figure 7‑10: Obese Adults as Percentage of All Adults, United States, Indiana, and Marion County, 1990-2005  7-17

Figure 7‑11: Percent of Marion County Adult Males in Each BMI Category, by Race and Ethnicity, 2005  7-18

Figure 7‑12: Percent of Marion County Adult Females in Each BMI Category, by Race and Ethnicity, 2005  7-19

Figure 7‑13: Marion County Adults Trying to Lose Weight in Past 12 Months, 2005. 7-20

Table 7‑7: Percent of Marion County Adults Who Tried to Lose Weight in Past 12 Months, by Gender, Age, and Race, 2005. 7-20

Figure 7‑14: 2005 Obesity Prevalence by Geographic Area, Marion County 2005. 7-21

7. Health Risk Factors and Prevention

Table 7‑1: Health Risk Factors and Prevention Summary Table

Measure

County Data

Recent Change

U.S. Comparison

IN Comparison

HP 2010

Yrs

% Change

DC

U.S. Data

DC

IN Data

DC

Positive Indicators for Marion County

% Adults trying to lose weight1

48.2%

(2005)

4

+77.2%

(2001-2005)

C

NA


NA


NA

Neutral Indicators for Marion County

%Cholesterol Screen / 5yrs1,2

71.5%

(2005)

4

-6.5%

(2001-2005)

DC

73.0%

(2005)

DC

71.3%

(2005)

DC  

12-15

80%

Negative Indicators for Marion County

% Obese

(BMI >30) 1

30% 3

(2005)

3

+15.4%

(2002-2005)

D

24.0%

(2005)

D

27.0%

(2005)

DC

19-2 15%

% High Cholesterol1,2

34.2%

(2005)

4

+21.3%

(2001-2005)

D

35.6%

(2005)

DC

38.0%

(2005)

DC

12-14 17%

% Smokers 1,2

24.4%

(2006)

6

-27.6%

(2000-2006)

C

20.1%

(2006)

D

24.1%

(2006)

DC

27-1a 12%

% Black Males

Who Smoke

30.7%

(2005)

4

+10.7%

(2001-2005)

D

NA


NA


27-1a 12%

% Never Smoked 1

47.3%

(2005)

3

-5.4%

(2002-2005)

DC

54.0%

(2005)

D

49.8%

(2005)

DC

NA

% Diagnosed High Blood Pressure 1,2

27.3%

(2005)

4

+9.2%

(2001-2005)

D

25.5%

(2005)

D

26.2%

(2005)

DC

12-9 16%

% Adults w/

No Physical Activity/ past month 1,2

27.7% 3

(2006)a

4

+12.6%

(2002-2006)

D

23.9%

(2005)

DC

26.9%

(2005)

DC

22-1 20%

1 CDC Behavioral Risk Factor Surveillance System (BRFSS) http://www.cdc.gov/brfss/ BRFSS data

2 2005 Marion County Adult Obesity Needs Assessment Survey (DR0502)

3. Based upon the Marion County SMART_BRFSS data for comparability to U.S. data. 

Table notes: County data: Is for most recent year available. Recent Change: Percent change of most recent measurement from a measurement the noted number of years prior.  Changes of more than 5 percent in either direction are denoted by thumbs up or thumbs down symbolsthumbs up or thumbs down.  Neutral thumbs indicate no change, even though no change may be a negative outcome; U.S. or IN population data: Is for most recent year available; U.S. (or IN) Comparison: Comparison of most recent data using thumbs up or thumbs down symbols to denote differences that are statistically significant or deemed to be noteworthy from the analysts’ professional perspective. Note: When there is no public health implication associated with a measure, directional arrows replace thumb icons to indicate the direction of change or the relationship of the Marion County measure (higher/lower/not different) to the U.S./IN measure.  


Several avoidable factors significantly contribute to health problems in our community, including asthma, heart disease and stroke, diabetes, cancer, arthritis, and other chronic disease outcomes such as cigarette smoking, obesity, unhealthy eating habits, and lack of physical activity.[184] Studies have demonstrated that there are effective strategies to prevent or control these risk factors[185], increasing health and quality of life, reducing the costs of absenteeism, disability, health care use[186], morbidity[187] and mortality due to chronic diseases.

Smoking

Smoking is a major risk factor for heart disease, stroke, lung cancer, and chronic lung diseases, all leading causes of mortality in the U.S.[188] Smoking during pregnancy also can result in low birth weight, miscarriages, premature delivery, and sudden infant death syndrome.[189]  Environmental tobacco smoke, or second hand smoke, increases the risk of heart disease and significant lung conditions, especially asthma and bronchitis in children.  Nationally, parental smoking was estimated to cause direct medical expenditures over $2.5 billion per year to care for smoking-caused problems of exposed newborns, infants, and children.[190] Cigarette smoking causes about one out of every five deaths in the U.S.[191]

Second hand smoke may also trigger myocardial infarctions (heart attacks) or asthma attacks. Adults and children with emphysema, asthma or other respiratory illnesses, for example, can suffer immediate distress from being exposed to cigarette smoke, sometimes leading to hospitalizations.[192]  By reducing the number of cigarettes smoked by adults and kids in the state each year, state tobacco-control programs also reduce other health problems, and related costs caused by secondhand smoke. 

The Healthy People 2010 objective 27-1a is to reduce to 12 percent the number of adults age 18 and over, who smoke.[193]  Based on data from the 2006 BRFSS, one in four (24.4%) Marion County adults smoke.  Marion County's adult current smoking prevalence was similar to Indiana's from 2001 through 2006, and consistently about 4 percentage points higher than that of the United States.  In both Indiana and Marion County, 2005 prevalence rates appeared to increase from 2004, but the change was not significant (Figure 7‑1).  Locally and nationally, the prevalence of adult smoking has had a slow, unsteady decline of about one-half of a percent per year over the past 6 years.[194]

Figure 7‑1: Current Smoking Among Adults, U.S., Indiana, and Marion County, 2000-2006

The vertical lines indicate the 95 percent confidence limit of the prevalence estimate.  The estimates' confidence limits for Marion County are wide, indicating that the true prevalence may vary from the given estimate by a few percent.  No confidence limits were available for the U.S. median.

* Confidence limits for Marion County were not available for 2000 and 2001. 

Source: CDC Behavioral Risk Factor Surveillance System (BRFSS) http://www.cdc.gov/brfss/ (Marion County Health Department DR0612).


The following results are based on a large local survey, which provided more specific information that could be obtained from the BRFSS.[195]  While smoking prevalence decreased among older age groups in Whites, prevalence increased among 24 to 64 year olds in Black and Hispanic groups.  White males (age 18 to 24 years) had the highest overall prevalence in 2005 (41%) of smoking, followed by young White females (34.2%).  Hispanics had the lowest smoking rates overall, especially among the young adults (10% to 21%) (Table 7‑2).

Table 7‑2: Prevalence of Smoking in Marion County by Age, Race, and Gender Groups, 2005

Current smoker (%)

All Ages

18-24

25-64

65+

White non-Hispanic Total

25.3

37.9

27.3

11.6

White non-Hispanic Males

28.5

41

29.9

13.7

White non-Hispanic Females

22.4

34.2

24.8

10.3

Black non-Hispanic Total

27

25.3

29.3

15

Black non-Hispanic Males

30.7

25

34

19.1

Black non-Hispanic Females

23.9

25.6

25.5

12.3

Hispanic or Other Race/Ethnicity Total

19.6

10.6

21.6

11.1

Hispanic or Other Race/Ethnicity Males

22

11.3

24.1

13.5

Hispanic or Other Race/Ethnicity Females

16.1

9.9

17.8

7.4

All Males

28.5

32

30.3

14.8

All Females

22.3

29

24.4

10.5

Marion County Total

25.3%

30.7%

27.3%

12.2%

Source: 2005 Marion County Adult Obesity Needs Assessment Survey (DR0502) Totals may not equal the sum of categories due to rounding.


Among adults over age 18, most race-gender groups showed downward trends in smoking prevalence between 2001 and 2005. However, black men had increased smoking rates over that period (Figure 7‑2).

Figure 7‑2: Smoking Prevalence in Marion County Adults Over 18, by Race and Gender, 2001 and 2005

Source: Marion County Community Health Assessment Telephone Survey (2001) and 2005 Marion County Adult Obesity Needs Assessment Survey (DR0502)


Marion County community surveys in 2001 and 2005 found that smoking prevalence decreased with greater educational achievement: 51 percent of persons without a high school degree smoked, compared to only 13.7 percent among college graduates in 2001. In 2005, some educational levels appear to have a decreased smoking prevalence compared to 2001.  However, due to the small sample size of the surveys that were used to collect this information and the large number of categories being examined, the differences between these percentages are not statistically significant (Table 7‑3 and Figure 7‑3).

Figure 7‑3: Marion County Smoking by Education Level

Source: Marion County Community Health Assessment Telephone Survey (2001); 2005 Marion County Adult Obesity Needs Assessment Survey (DR0502)


Table 7‑3: Marion County Prevalence of Smoking in Adults, by Race, Gender and Educational Achievement, 2005


Level of education

Percent Smokers

Overall

8th grade or less

Some High School

High School graduate

Some college

College graduate

White non-Hispanic Total

25.3

49.6

52.1

36.4

28

13.2

White Males

28.5

51.4

65.4

43.8

30.3

14.7

White Females

22.4

48.6

39

30.4

26.1

11.7

Black non-Hispanic Total

27

7.1

49.5

31.6

24.8

12.9

Black Males

30.7

17.6

54.6

28.1

32.1

19.7

Black Females

23.9

0

44.7

35.2

19.5

8.4

Hispanic Total

18.1

14.8

18.7

18.5

23.8

16.8

Hispanic Males

23.1

24.2

26.9

25.2

25.9

13.8

Hispanic Females

10

0

6.9

8.1

18.6

21.1

Other Ethnicity Total

22.5

53.9

40.4

25.4

21.6

16.2

Other Males

19.7

0

50

0

10.3

22

Other Females

25.8

100

37.3

47.1

32.4

6.4

All Males

28.5

28.4

57.9

37.1

30

15.7

All Females

22.3

23.1

38.6

30.8

24

11

Marion County Total

25.3

25.6

48.2

33.8

26.7

13.4

Source: 2005 Marion County Adult Obesity Needs Assessment Survey (DR0502) Totals may not equal the sum of categories due to rounding.


In Marion County the majority of smokers in both 2002 and 2005 reported smoking at least daily.  However, more smokers changed from smoking everyday to only smoking on some days.  Among smokers, the prevalence of intermittent-smoking increased from 15 percent in 2002 to 27 percent in 2005 (Figure 7‑4).[196]  In the state 49.8 percent of residents, and nationally 54 percent of Americans have never smoked (2005).

Figure 7‑4: Marion County: Smoking Status, 2002 and 2005

Source: http://apps.nccd.cdc.gov/brfss-smart/CompareCtyRiskChart.asp?MMSA=39&yr2=2005&cat=TU&qkey=4394&cty=38&cty2=NONE&yr1=2002&SUBMIT1=Go


Health Screening Tests

Serum Cholesterol Levels

Serum cholesterol levels indicate adults’ risk of heart disease and stroke.[197]  In 2005, 71.5 percent of Marion County adults reported having had at least one cholesterol check within the past 5 years.  This represents a six and a half percentage point decrease from the 2001 Marion County adult screening rate, though the difference may be due to sampling error.[198] 

Marion County rates were similar to the screening rates for adults in the state (71.3%) and in the nation (73%).  The Healthy People 2010 objective 12-15 is that 80 percent of adults have had their cholesterol levels screened within the past 5 years[199] (Figure 7‑5).

Figure 7‑5: Adults with Cholesterol Screening, Past 5 Years: Marion County, Indiana, and U.S., 2001-2005

Source: Marion County Community Health Assessment Telephone Survey (2001, 1999); Indiana Behavioral Risk Factor Surveillance System Data, Indiana State Department of Health (2001, 2003, 2005); National Behavioral Risk Factor Surveillance System Data, 2001, 2003, 2005


Elevated Cholesterol Levels

Among Marion County adults who reported cholesterol checks in 2005, 34.2 percent reported being told by a health professional that their cholesterol level was elevated, putting them at greater risk of heart disease and stroke.  This is an upward, but not statistically significant change from previous years, and is similar to adults’ reported elevated cholesterol in the state (38.0) and nation (35.6) (Table 7‑4 and Figure 7‑6).  High cholesterol was most prevalent among White (25.1) and Black (22.1) men. CDC’s Healthy People 2010 objective 12-14 is to reduce the prevalence of elevated cholesterol in adult populations to no more than 17 percent[200].

Table 7‑4: Percentage of Screened Marion County Adults Told They Have Elevated Cholesterol, by Race and Gender, 2005

Race/Gender Group

Marion County Population Aged 25-64

Total Marion County Population

Total Indiana 2005

Total U.S. 2005

White Total

23.4

25.7

38.0

36.6

White Male

25.1

25.6

NA

NA

White Female

21.8

25.8

NA

NA

Black Total

19.4

19.9

34.2

30.7

Black Male

22.1

20.8

NA

NA

Black Female

17.4

19.1

NA

NA

Other Total

17.2

16.6

NA

NA

Other Male

16.7

16.4

NA

NA

Other Female

18.1

16.8

NA

NA

All Males

23.7

23.7

39.3

37.3

All Females

20.4

23.7

36.8

34.4

Marion County Total

22.0

23.7

38.0

35.6

Source: 2005 Marion County Adult Obesity Needs Assessment Survey (DR0502); National Behavioral Risk Factor Surveillance System Data, CDC (2005). Totals may not equal the sum of categories due to rounding.


Figure 7‑6: Percentage of Screened Adults Told Their Cholesterol Was High, Marion County, Indiana, and U.S., 1999-2005

Source: Marion County Community Health Assessment Survey (2001), 2003 SMART_BRFSS survey ,and Adult Obesity survey (2005); Indiana BRFSS Data, Indiana State Department of Health (2000-2005); National BRFSS Data, CDC (2000-2005); Healthy People 2010, U.S. Department of Health and Human Services.

High Blood Pressure

High blood pressure is a “silent” or relatively non-symptomatic condition that remains a major risk factor for coronary heart disease, stroke, and heart and kidney failure, even though it can be prevented or controlled.[201] High blood pressure is more common with advancing age and among persons who smoke or are obese.  Many lifestyle changes help prevent high blood pressure, including increasing physical activity, maintaining an appropriate weight for one’s height, moderating consumption of alcohol, reducing sodium intake, and eating a reduced fat diet, including at least five servings of fruits and vegetables each day.

In 2001, 25 percent of Marion County adults had been told by a health professional that they had high blood pressure,[202] increasing to 27.3 in 2005[203] (Table 7‑5).  As in previous years, the prevalence of reported high blood pressure is greatest among Black men and women, compared to other ethnicity groups. Over one in three Black women (34.8%) reported being told they have high blood pressure.

The prevalence of high blood pressure overall in Marion County was not significantly higher than that seen in the state (26.2%) or nation (25.5%); however, the prevalence of reported hypertension reached over 30 percent among Black men and women. All rates were far from the Healthy People 2010 Objective 12-9 of 16 percent prevalence of elevated blood pressure among adults[204].

At least 1 in 4 Marion County adults have at least two of the known risk factors for heart attack and stroke (Figure 7‑7).  These risk factors include elevated cholesterol levels, high blood pressure, current smoking or lifetime prevalence of asthma.

Table 7‑5: Percentage of Marion County, Indiana and U.S. Adults Told by a Health Professional That They Had High Blood Pressure, by Race and Gender, 2005

Race/Gender

Marion County Adults 25-64

Marion County Adults over 18

Indiana Adults  over 18

Total U.S.

White Total

21.3

26.4

25.9

26.0

White Male

20.5

23.9

NA

NA

White Female

22.0

28.7

NA

NA

Black Total

30.2

32.4

35.0

34.0

Black Male

30.6

29.5

NA

NA

Black Female

29.8

34.8

NA

NA

Other Total

18.0

18.4

NA

NA

Other Male

18.2

18.7

NA

NA

Other Female

17.7

18.1

NA

NA

All Males

22.4

24.7

26.5

25.4

All Females

23.7

29.8

25.9

24.9

Adults with HBP

23.1

27.3

26.2

25.5

Source: 2005 Marion County Adult Obesity Needs Assessment Survey 02/23/07 (DR0502); National Behavioral Risk Factor Surveillance System Data, CDC (2005). Totals may not equal the sum of categories due to rounding.


Figure 7‑7: Marion County Adults Reporting Multiple Cardiovascular and Respiratory Conditions, 2005

Source: http://apps.nccd.cdc.gov/brfsssmart/CompareCtyRiskChart.asp?MMSA=39&yr2=2005&cat=TU&qkey=4394&cty=38&cty2=NONE&yr1=2002&SUBMIT1=Go


Cancer Screening

Breast cancer, colorectal and cervical cancer deaths can be prevented by periodic screenings, so the early clinical changes may be detected, and early treatment may be initiated. 

Cancer screening rates for female breast and cervical cancers, male prostate cancer and lung cancer are discussed under “Cancer Incidence - Health Screenings for Early Detection” in Section 12, Morbidity and Hospitalizations, of this report.

Lifestyle Factors

Physical Activity

Physically active individuals live longer than those who are inactive.  The role of physical activity in preventing coronary heart disease is of particular importance.[205]  Even if physical activity is not vigorous, it can still produce health benefits, including a reduced risk of heart disease and diabetes[206] and improvements in other clinically significant risk factors such as obesity[207], high blood pressure[208], and high cholesterol levels.[209] Physical activity also has been shown to reduce risk of bone loss (osteoporosis)[210], certain cancers, such as colon cancer[211], as well as reducing depressive symptoms in adults.[212]

The Healthy People 2010 objective 22-1 is to reduce the proportion of adults who engage in no leisure time physical activity to 20 percent.[213]  The CDC recommends at least 30 minutes of moderate intensity activity five days per week, or at least 20 minutes of vigorous intensity physical activity three days per week.

In 2005 surveyed adults were asked if they “walked in their neighborhood for exercise”. Daily walking was significantly higher among Black males (27), while Black females had significantly greater rates of “never” walking (35).  Hispanics and Whites of both genders had similar prevalence of daily walking (15 to 20) and never walking (20 to 25) (See Figure 7‑8).

Figure 7‑8: Frequency of Walking for Exercise, by Gender and Race, Marion County Adults, 2005

Source: 2005 Marion County Adult Obesity Needs Assessment Survey DR0502


According to the BRFSS survey, in 2006 over a quarter of Marion County adults (27.7%) reported no physical activity over the past month.  This is up from 24.6 percent of adults in 2002.[214]  This is similar to state (26.9%) and national (23.9%) prevalence of sedentary adults in 2006. Exercise is known to be effective in lowering blood pressure. Of Marion County adults who knew they had elevated blood pressure, less than half met the CDC’s recommended moderate level of weekly physical activity.

Overweight and Obesity Status

Obesity is the second major contributor to U.S. total preventable deaths, behind smoking.[215] Higher body weights and Body Mass Index scores[216] (BMI) are associated with greater risk of premature death[217], and costly morbidity[218] through heart disease[219], diabetes, stroke, arthritis and some cancers.[220] The prevalence of high blood pressure (hypertension), and the risk of stroke, heart attack, and type 2-diabetes incidence double as BMI increases from the normal-range (22 to 25) to obese (BMI over 30).[221]

In Marion County in 2005, among adults who were not pregnant, one percent had BMI values in the Underweight range (less than 18.5), 38 percent had BMI values in the Normal range (18.5 to less than 25), 35 percent had BMI values in the Overweight range (25 to less than 30), and 26 percent had BMI values in the Obese range (BMI of 30 or more), including 4 percent who were Morbidly Obese (BMI of 40 or more).[222]  The detailed distribution of BMI is shown in Figure 7‑9 and Table 7‑6.  The CDC’s Healthy People 2010 objective 19-2 is to reduce the prevalence of adult obesity to 15 percent[223].

Figure 7‑9: Percent of Non-Pregnant Marion County Residents, Age 18 Years or Older, by BMI Category, 2005

Source: 2005 Marion County Adult Obesity Needs Assessment Survey, Marion County Health Department (DR0266) http://www.mchd.com/obesitysurvey.htm


Table 7‑6: Prevalence of BMI Categories, Marion County Adults, 2005

BMI Category

Estimated Prevalence

95 Confidence Interval

Underweight

1.4

1.8-1.0

Normal

37.9

39.5-36.4

Overweight

35.1

36.6-33.5

Obese

21.6

22.9-20.3

Morbidly Obese

4.0

4.6-3.4

Source: 2005 Marion County Adult Obesity Needs Assessment Survey, Marion County Health Department DR0266 http://www.mchd.com/obesitysurvey.htm


The 2005 BRFSS survey ranks Indiana 4th among states in the prevalence of obesity.  Indiana adult obesity rates have not only followed the increasing national trend of obesity prevalence over the past 15 years, but have regularly exceeded national percentages.  Obesity rates in Marion County are similar to or even greater than those in Indiana (Figure 7‑10).

Figure 7‑10: Obese Adults as Percentage of All Adults, United States, Indiana, and Marion County, 1990-2005

Source: CDC BRFSS http://www.cdc.gov/brfss/ and 2005 Marion County Adult Obesity Needs Assessment Survey, Marion County Health Department (DR0435) http://www.mchd.com/obesitysurvey.htm


Black males had a higher prevalence of obesity (28) than did White males (24).  White males had a higher prevalence of obesity than did Hispanic (19) males (Figure 7‑11). Almost half of Hispanic males were overweight.

The differences by race between males were not nearly as great as the differences between females.  The BMI distributions of the male racial groups all had roughly the same shape, with overweight being most common, and obesity being least common.


Figure 7‑11: Percent of Marion County Adult Males in Each BMI Category, by Race and Ethnicity, 2005

Source: 2005 Marion County Adult Obesity Needs Assessment Survey, Marion County Health Department (DR0266) http://www.mchd.com/obesitysurvey.htm


Figure 7‑12: Percent of Marion County Adult Females in Each BMI Category, by Race and Ethnicity, 2005

Source: 2005 Marion County Adult Obesity Needs Assessment Survey, Marion County Health Department (DR0266) http://www.mchd.com/obesitysurvey.htm


In contrast, the BMI distributions among females clearly differed by race or ethnicity.  Female BMI values were skewed in a more healthy direction among White and Hispanic women, and in a less healthy direction among Black women.  Black females had a 70 percent higher prevalence of obesity (39), than White (23) or Hispanic females (23), and a correspondingly lower prevalence of BMI values in the Normal or Underweight category (Figure 7‑12).  White and Hispanic females had a high prevalence of BMI values in the Normal or Underweight range compared to all other race-by-gender groups.

Overall, a quarter of Marion County adults were obese in 2005, and 60 percent were either overweight (BMI>25) or obese.  Obesity was common in all demographic groups. The distribution of obesity by health planning area of Marion County is seen in Figure 7‑14.

Advice from clinicians: One-third of obese adults and two-thirds of overweight adults reported that a doctor had not told them that they were overweight. Many obese adults (over 40) and most adults who are not obese (50 to 75) had not received nutrition or physical activity advice from their doctors.

Between 2001 and 2005, the portion of adults trying to lose weight almost doubled[224], as obesity has come to the front of public and media attention as a national health problem. In 2005, nearly half of adults reported attempting to lose weight in the prior 12 months (Figure 7‑13 and Table 7‑7).   Women in all racial groups were more likely to have tried losing weight than men. Working-age adults were more likely to have tried losing weight than either youth or the elderly.[225]

Figure 7‑13: Marion County Adults Trying to Lose Weight in Past 12 Months, 2005

Source: 2005 Marion County Adult Obesity Needs Assessment Survey (DR0502)


Table 7‑7: Percent of Marion County Adults Who Tried to Lose Weight in Past 12 Months, by Gender, Age, and Race, 2005

Race/Gender Group

Total

18-24

25-64

65+

White, non-Hispanic

49.3

45.1

52.3

37.2

White Males

42.1

37.7

43.2

36.9

White Females

56.1

53.9

61.2

37.4

Black non-Hispanic

44.4

37.2

48.2

27.6

Black Males

34.6

36.4

34.8

30.3

Black Females

52.7

38.5

59

25.9

Hispanic/ Other Ethnicity

50.2

48

51.8

34.5

Hispanic/Other Males

38.5

23.5

40.2

43.2

Hispanic/ Other Females

67.3

75.4

69.2

22.4

All Males

40.1

35.7

41.3

35.7

All Females

55.8

51

61.1

35.2

Marion County Total

48.2

42.3

51.3

35.4


In 1999, direct health care costs of obesity for the U.S. were estimated at 70 billion dollars or 7 percent of total U.S. health care costs.[226]  Oster et al., using obesity levels from the NHANES national sample, estimated that U.S. adults’ the future per capita lifetime costs for obesity would be comparable to those of smoking.[227] 

Figure 7‑14: 2005 Obesity Prevalence by Geographic Area, Marion County 2005


[184]U.S. Department of Health and Human Services. Healthy People 2010: Understanding and Improving Health. 2nd ed. Washington, DC: U.S. Government Printing Office, November 2000. http://www.healthypeople.gov/document/tableofcontents.htm#under

[185] Zaza S, Briss PA, Harris KW, eds. The guide to community preventive services: what works to promote health? New York, NY: Oxford University Press; 2005of Health and Human Services; 2000. http://www.thecommunityguide.org/library/gen-AJPM-c-book-review.pdf

[186]California’s tobacco control program' reduced adult smoking in its first seven years producing direct savings of $390 million in adult health care costs, due to declines in smoking. Lightwood JM, Glantz SA. Short-term economic and health benefits of smoking cessation, myocardial infarction and stroke. Circulation 1997; 96:1089-1096 http://circ.ahajournals.org/cgi/content/abstract/96/4/1089

[187]Heart attacks and strokes declined in the first 2 years of California’s smoking law saving more than $25 million in the first two years. Lightwood JM, Glantz SA. Short-term economic and health benefits of smoking cessation, myocardial infarction and stroke. Circulation 1997; 96:1089-1096 http://circ.ahajournals.org/cgi/content/abstract/96/4/1089

[188] U.S. Department of Health and Human Services. 2006 Surgeon General Report-the Health Consequences of Involuntary Exposure to Tobacco Smoke http://www.cdc.gov/tobacco/data_statistics/sgr/sgr_2006/index.htm 

[189]Miller D P, Villa KF, Hogue SL, Sivapathasundaram D. Birth and First-Year Costs for Mothers and Infants Attributable to Maternal Smoking. Nicotine & Tobacco Research 2001; 3(1): 25-35.

[190]Aligne, CA, Stoddard JJ. Tobacco and Children. An economic evaluation of the medical effects of parental smoking. Archives of Pediatric and Adolescent Medicine, 1997; 151(7): 648-653.

[191] Amour BS, Woollery T, Malarcher A, Pechacek TF, Husten C. Annual Smoking–Attributable Mortality, Years of Potential Life Lost, and Productivity Losses—United States, 1997–2001. Morbidity and Mortality Weekly Report [serial online], 2005: 54(25) 625-628. http://www.cdc.gov/mmwr/preview/mmwrhtml/mm5425a1.htm

[192]California Environmental Protection Agency, Office of Environmental Health Hazard Assessment 1997 final report. http://www.oehha.org/air/environmental_tobacco/finalets.html

[193] U.S. Department of Health and Human Services. Healthy People 2010: Understanding and Improving Health. 2nd ed. Washington, DC: U.S. Government Printing Office, November 2000. Objective 27-1a. http://www.healthypeople.gov/document/html/objectives/27-01.htm

[194] Centers for Disease Control and Prevention (CDC). Behavioral Risk Factor Surveillance System Survey Data. Atlanta, Georgia: U.S. Department of Health and Human Services, Centers for Disease Control and Prevention, [2006] http://www.cdc.gov/brfss/

[195] The national BRFSS survey provides consistent data to all comparisons between local, state, and national statistics, but does not have a large enough local sample to provide reliable estimates for local subpopulations.  The following results are based on two local surveys that included several thousand respondents, rather than the several hundred available from the BRFSS.  The results differ only slightly, and are within the margin of error expected between the BRFSS and local surveys.

[196] Marion County specific data from 2002-2005 SMART_BRFSS surveys of the Indianapolis MSA

[197] Labarthe DR. Epidemiology and Prevention of Cardiovascular Diseases: A Global challenge 1998. Gaithersburg MD: Aspen Publishing, pp223-260.

[198] Marion County Community Health Assessment Telephone Survey (2001, 1999); Indiana Behavioral Risk Factor Surveillance System Data, Indiana State Department of Health (2001, 2003, 2005); National Behavioral Risk Factor Surveillance System Data, 2001, 2003, 2005

[199]U.S. Department of Health and Human Services. Healthy People 2010: Understanding and Improving Health. 2nd ed. Washington, DC: U.S. Government Printing Office, November 2000. Objective 12-15. http://www.healthypeople.gov/document/html/objectives/12-15.htm

[200] U.S. Department of Health and Human Services. Healthy People 2010: Understanding and Improving Health. 2nd ed. Washington, DC: U.S. Government Printing Office, November 2000. Objective 12-14. http://www.healthypeople.gov/document/html/objectives/12-14.htm

[201] Labarthe DR. Epidemiology and Prevention of Cardiovascular Diseases: A Global challenge 1998. Gaithersburg MD: Aspen Publishing, pp223-260.

[202] 2001 Marion County Health Assessment Survey

[203] 2005 Marion County Obesity Needs Assessment (DR0502)

[204] U.S. Department of Health and Human Services. Healthy People 2010. 2nd ed. Objective 12-9

http://www.healthypeople.gov/Document/HTML/Volume1/12Heart.htm#_Toc490544223

[205]Physical Activity and Cardiovascular Health. NIH Consensus Development Panel on Physical Activity and Cardiovascular Health. JAMA 1996; 276(3): 241-246.

[206] Burchfiel CM, Sharp DS, Curb JD et al. Physical activity and incidence of diabetes: the Honolulu Heart Program. Am J Epidemiol 1995;141(4):360-8.

[207] Sallis JF, Patterson TL, Buono MJ, Nader PR. Relation of cardiovascular fitness and physical activity to cardiovascular disease risk factors in children and adults. Am J Epidemiol 1988; 127(5):933-41.

[208] Hansen HS, Froberg K, Hyldebrandt N, Nielsen JR. A controlled study of eight months of physical training and reduction of blood pressure in children: the Odense schoolchild study. Br Med J 1991;303:682-5.

[209] Blessing DL, Keith RE, Williford HN, Blessing ME, Barksdale JA. Blood lipid and physiological responses to endurance training in adolescents. Pediatr Exercise Sci 1995;7:192-202.

[210] Pruitt LA, Jackson RD, Bartels RL, Lehnhard HJ. Weight-training effects on bone mineral density in early postmenopausal women. J Bone Miner Res 1992;7(2):179-85.

[211] Lee I-M, Paffenbarger RS Jr, Hsieh C-C. Physical activity and risk of developing colorectal cancer among college alumni. J Natl Cancer Inst 1991;83:1324-9.

[212] Farmer ME, Locke BZ, Mocicki EK, Dannenberg AL, Larson DB, Radloff LS. Physical activity and depressive symptoms: the NHANES I Epidemiologic Follow-up Study. Am J Epidemiol 1988;128(6):1340-51.

[213] U.S. Department of Health and Human Services. Healthy People 2010: Understanding and Improving Health. 2nd ed. Washington, DC: U.S. Government Printing Office, November 2000. Objective 22-1. http://www.healthypeople.gov/document/html/objectives/22-01.htm

[214] Marion County specific data from 2002-2005 SMART_BRFSS surveys of the Indianapolis MSA http://apps.nccd.cdc.gov/brfss-smart/CompareCtyRiskChart.asp?MMSA=39&yr2=2006&cat=EX&qkey=4347&cty=38&cty2=NONE&yr1=2002&SUBMIT1=Go

[215]McGinnis JM et al. Actual causes of death in the United States. JAMA. 1993; 270(18):2207-2212.

[216] BMI is defined as weight in kilograms divided by height in meters squared (w/h**2)

[217]Manson JE et al. Body weight and mortality among women. NEJM 1995; 333(11): 677–685.

[218]Colditz G. The economic costs of obesity. Am. J. Clin. Nutr. 1992; 55: 503S-507S.

[219] Labarthe DE. Epidemiology and Prevention of Cardiovascular Diseases: A Global challenge 1998. Gaithersburg MD: Aspen Publishing, pp 193-221.

[220]Rimm E B et al. Body size and fat distribution as predictors of CHD among middle-aged and older U.S. men. Am. J. Epidemiol. 1995; 141: 1117–1127.

[221]National Institutes of Health, National Heart, Lung, and Blood Institute http://www.nhlbi.nih.gov/guidelines/obesity/ob_gdlns.pdf

[222] 2005 Marion County Adult Obesity Needs Assessment Survey, Marion County Health Department (DR0266) http://www.mchd.com/obesitysurvey.htm

[223] U.S. Department of Health and Human Services. Healthy People 2010. 2nd ed. Objective 19-2 http://www.healthypeople.gov/Document/HTML/Volume2/19Nutrition.htm#_Toc490383123


[224] 2001 Marion County Community Needs Assessment Survey, 2005 Marion County Obesity Needs Assessment Survey (DR0502).

[225] 2005 Marion County Obesity Needs Assessment Survey (DR0502)

[226]Colditz GA. Economic costs of obesity and inactivity. Med. Sci. Sports Exerc. 1999; 31(11):S663–S667.

[227]Oster G, Thompson D, Edelsberg J, Bird AP, Colditz GA. Lifetime health and economic benefits of weight loss among obese persons. Am. J. Public Health 1999; 89(10):1536-1542.